

Building a Comprehensive Databricks Usage Dashboard on AWS with Unity Catalog
Building a Comprehensive Databricks Usage Dashboard on AWS with Unity Catalog
Tracking and visualizing your Databricks usage metrics is key to understanding team adoption, data asset growth, cluster performance, and user behavior. With Unity Catalog enabled on Databricks (AWS), you gain access to system tables that, when combined with Python-based ingestion jobs and SQL dashboards, enable rich insights into platform utilization. This guide walks through building a powerful, automated usage dashboard from scratch—across multiple workspaces.
✨ Overview of What We’re Building
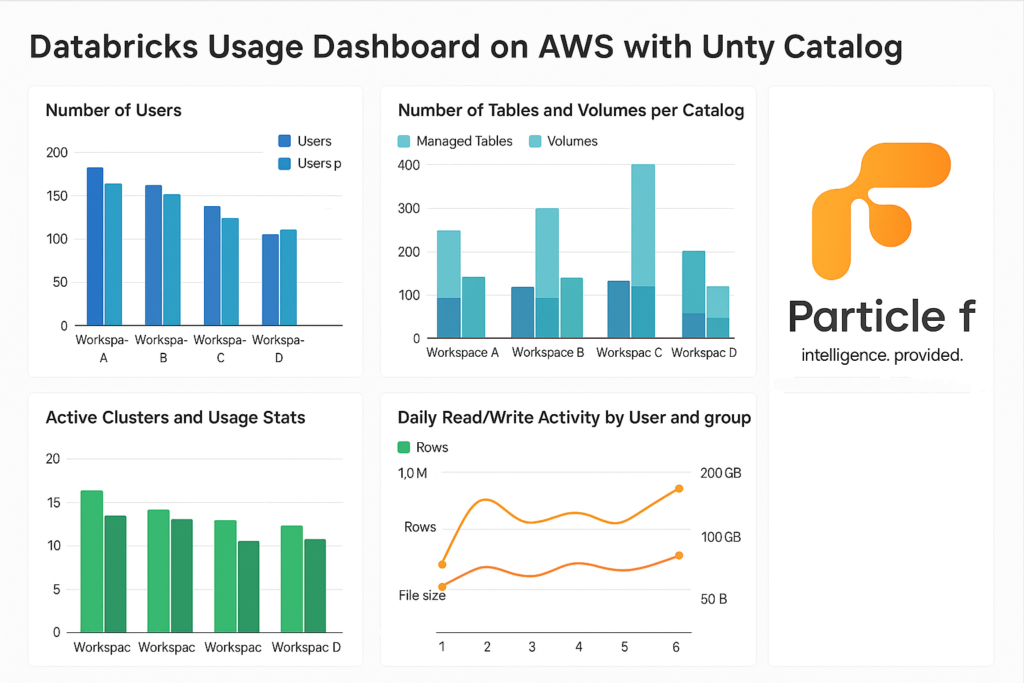
The dashboard will capture and visualize the following metrics for each workspace independently:
- Number of users and users per group (allowing users in multiple groups)
- Number of tables (managed only) and volumes per catalog
- Table sizes and row counts
- Notebooks, workflows, and models per user group
- Active clusters and usage stats (CPU, DBU, etc.)
- Daily read/write activity by user and group (rows, file size)
We’ll leverage:
- Unity Catalog system tables (information_schema, system.access, system.compute)
- Databricks REST APIs (SCIM, Workspace, MLflow)
- Python jobs to extract and populate landing Delta tables
- SQL Dashboards for visualization
⚙️ Landing Layer Metrics
1. User & Group Mapping (Users in Multiple Groups)
from pyspark.sql import SparkSession
spark = SparkSession.builder.getOrCreate()

# Replace this block with actual SCIM API or Unity Catalog export logic
scim_users = spark.read.format("json").load("/databricks-datasets/scim/users.json")
scim_groups = spark.read.format("json").load("/databricks-datasets/scim/groups.json")

user_map = {row['id']: row['userName'] for row in scim_users.collect()}
records = []
for group in scim_groups.collect():
    gname = group['displayName']
    for member in group.get('members', []):
        uid = member['value']
        uname = user_map.get(uid, None)
        if uname:
            records.append((uid, uname, gname))

spark.createDataFrame(records, ["user_id", "user_name", "group"]) \
    .write.format("delta").mode("overwrite").saveAsTable("abc.monitoring.user_group_mapping")
2. Table Stats (Managed Tables Only, Group Mapping from Catalog Tag with Human-Readable Size)
from pyspark.sql.functions import lit

# Get all tables
tables_df = spark.sql("""
  SELECT table_catalog, table_schema, table_name
  FROM system.information_schema.tables
  WHERE table_type = 'MANAGED'
    AND table_catalog NOT LIKE 'system%'
""")

# Get catalog-level group mapping from tags
if 'catalog_tags_df' not in locals():
    catalog_tags_df = spark.sql("""
      SELECT catalog_name, tag_value AS group
      FROM system.information_schema.catalog_tags
      WHERE tag_name = 'groupname'
    """)

# Join tables with groupname from their catalog
joined_df = tables_df.join(catalog_tags_df, tables_df.table_catalog == catalog_tags_df.catalog_name, "inner")

# Create full table name and get DESCRIBE DETAIL
from pyspark.sql import Row

def describe_table(row):
    try:
        full_name = f"{row.table_catalog}.{row.table_schema}.{row.table_name}"
        desc = spark.sql(f"DESCRIBE DETAIL {full_name}").first()
        size = desc['sizeInBytes']
        rows = spark.sql(f"SELECT COUNT(*) AS cnt FROM {full_name}").first()["cnt"]
        size_readable = (
            f"{round(size / (1 << 30), 2)} GB" if size >= 1 << 30 else
            f"{round(size / (1 << 20), 2)} MB" if size >= 1 << 20 else
            f"{round(size / (1 << 10), 2)} KB" if size >= 1 << 10 else
            f"{size} B"
        )
        return Row(
            catalog=row.table_catalog,
            schema=row.table_schema,
            table_name=row.table_name,
            row_count=rows,
            size_bytes=size,
            size_readable=size_readable,
            group=row.group
        )
    except:
        return None

detailed_data = list(filter(None, [describe_table(row) for row in joined_df.collect()]))
df = spark.createDataFrame(detailed_data)
df.show(truncate=False)
df.write.format("delta").mode("overwrite").saveAsTable(f"{catalog_name}.monitoring.table_stats")
3. Volumes per Catalog (with Size and Object Count, Group Mapping)
volumes_df = spark.sql("""
  SELECT volume_catalog, volume_schema, volume_name
  FROM system.information_schema.volumes
  WHERE volume_catalog NOT LIKE 'system%'
""")

joined_df = volumes_df.join(catalog_tags_df, volumes_df.volume_catalog == catalog_tags_df.catalog_name, "inner")

from pyspark.sql.functions import lit
from pyspark.sql import Row
import os

def get_volume_details(volume_catalog, volume_schema, volume_name):
    try:
        volume_path = f"/Volumes/{volume_catalog}/{volume_schema}/{volume_name}"
        size_bytes = sum(
            os.path.getsize(os.path.join(dirpath, filename))
            for dirpath, _, filenames in os.walk(volume_path)
            for filename in filenames
        )
        file_count = sum(
            len(filenames)
            for _, _, filenames in os.walk(volume_path)
        )
        size_readable = (
            f"{round(size_bytes / (1 << 30), 2)} GB" if size_bytes >= 1 << 30 else
            f"{round(size_bytes / (1 << 20), 2)} MB" if size_bytes >= 1 << 20 else
            f"{round(size_bytes / (1 << 10), 2)} KB" if size_bytes >= 1 << 10 else
            f"{size_bytes} B"
        )
        return Row(
            catalog=volume_catalog,
            volume_schema=volume_schema,
            volume_name=volume_name,
            size_bytes=size_bytes,
            size_readable=size_readable,
            object_count=file_count,
            group=row.group
        )
    except Exception as e:
        return None

detailed_data = []
for row in joined_df.collect():
    detail = get_volume_details(row.volume_catalog, row.volume_schema, row.volume_name)
    if detail:
        detailed_data.append(detail)

df = spark.createDataFrame(detailed_data)
df.write.format("delta").mode("overwrite").saveAsTable(f"{catalog_name}.monitoring.volume_stats")
4. Notebooks per User Group
from databricks.sdk import WorkspaceClient
import re
from collections import defaultdict

# Initialize the WorkspaceClient
w = WorkspaceClient()

# Recursively list all workspace files
result = w.workspace.list("/Users", recursive=True)
notebook_owners = defaultdict(int)

# Count notebooks per user based on path
for obj in result:
    if obj.object_type == "NOTEBOOK":
        m = re.match("/Users/([^/]+)", obj.path)
        if m:
            owner = m.group(1)
            notebook_owners[owner] += 1

# Create DataFrame from counts and join with group mapping
df = spark.createDataFrame([(k, v) for k, v in notebook_owners.items()], ["user_name", "notebook_count"])
df.join(spark.table(f"{catalog_name}.monitoring.user_group_mapping"), "user_name") \
  .groupBy("group").sum("notebook_count") \
  .withColumnRenamed("sum(notebook_count)", "notebook_count") \
  .write.format("delta").mode("overwrite").saveAsTable(f"{catalog_name}.monitoring.notebook_counts")
5. Jobs (Workflows) per Group
CREATE OR REPLACE TABLE abc.monitoring.job_counts AS
SELECT g.group, COUNT(DISTINCT j.job_id) AS job_count
FROM system.lakeflow.jobs j
JOIN abc.monitoring.user_group_mapping g ON j.creator = g.user_name
GROUP BY g.group;
6. Models per Group (MLflow Registry)
import mlflow
mlflow.set_tracking_uri("databricks")

models = mlflow.search_registered_models()
data = []
for m in models:
    creator = m.tags.get("mlflow.creator")
    if creator:
        data.append((creator, m.name))

df = spark.createDataFrame(data, ["user_name", "model_name"])
df.join(spark.table("abc.monitoring.user_group_mapping"), "user_name") \
  .groupBy("group").count() \
  .withColumnRenamed("count", "model_count") \
  .write.format("delta").mode("overwrite").saveAsTable("abc.monitoring.model_counts")
7. Active Clusters and Usage Stats (Daily Duration and Human-Readable Size)
CREATE OR REPLACE TEMP VIEW cluster_activity AS
SELECT
  cluster_id,
  usage_date,
  SUM(dbu_cost) AS total_dbu,
  SUM(usage_quantity) AS total_hours,
  ROUND(SUM(usage_quantity) * 60, 0) AS total_minutes
FROM system.billing.usage
WHERE usage_date >= current_date() - 30
GROUP BY cluster_id, usage_date;

CREATE OR REPLACE TABLE abc.monitoring.cluster_usage AS
SELECT
  c.cluster_id,
  c.cluster_name,
  c.creator,
  a.usage_date,
  a.total_dbu,
  a.total_hours,
  a.total_minutes,
  CASE
    WHEN a.total_dbu >= 1000000000 THEN ROUND(a.total_dbu / 1000000000, 2) || ' GB'
    WHEN a.total_dbu >= 1000000 THEN ROUND(a.total_dbu / 1000000, 2) || ' MB'
    WHEN a.total_dbu >= 1000 THEN ROUND(a.total_dbu / 1000, 2) || ' KB'
    ELSE ROUND(a.total_dbu, 2) || ' B'
  END AS dbu_cost_human
FROM cluster_activity a
JOIN system.compute.clusters c
  ON c.cluster_id = a.cluster_id;
8. Daily Read/Write Activity by User and Group
CREATE OR REPLACE TABLE abc.monitoring.daily_access_stats AS
SELECT event_date AS date,
       created_by AS user_name,
       COUNT(CASE WHEN read_type IS NOT NULL THEN 1 END) AS read_ops,
       COUNT(CASE WHEN write_type IS NOT NULL THEN 1 END) AS write_ops
FROM system.access.table_lineage
WHERE event_date >= current_date() - 30
GROUP BY event_date, created_by;

CREATE OR REPLACE TABLE abc.monitoring.daily_group_access_stats AS
SELECT a.date, g.group,
       SUM(read_ops) AS total_reads,
       SUM(write_ops) AS total_writes
FROM abc.monitoring.daily_access_stats a
JOIN abc.monitoring.user_group_mapping g ON a.user_name = g.user_name
GROUP BY a.date, g.group;
With all metrics now captured in the landing tables within abc.monitoring, you’re ready to build SQL dashboards and/or schedule data refresh pipelines.